Authored By Scott George, Co-Chief Executive Officer, Co-Chief Investment Officer, and President, Thomas Rolfe Pudner, CFA, CPA, CFP®, MST, Co-CIO & Co-Director of Research and Jason S. Doyle, Co-Director of Research | Mason Investment Advisory Services, Inc.
Key Takeaways
- Rising U.S. Treasury yields refocused market attention on rebalancing opportunities in the bond market.
- Geopolitical tensions in the Middle East contributed to a rise in oil and gas prices, supporting energy-related investments.
- Global equities remained resilient despite an increasingly challenging economic backdrop.
Q3 2026 Market Summary
Attractive Opportunities Emerging in the Fixed Income Space
U.S. Treasury yields surpassed 5.0% during the third quarter as renewed inflation concerns, continued growth of the U.S. national debt, and rising corporate debt issuance to fund artificial intelligence infrastructure placed upward pressure on interest rates. The long end of the U.S. Treasury yield curve (generally U.S. Treasury notes with maturities of 10 years or longer) is heavily influenced by broader market forces including inflation expectations, economic growth outlooks, and the balance between U.S. Treasury supply to cover fiscal deficits and market demand. The yields of shorter-term maturities are determined by the interest rate decisions of the Federal Reserve’s Federal Open Market Committee (FOMC).
The impact of rising yields on bond funds is twofold. In the near term, rising yields reduce the present value of future coupon payments as those cash flows are discounted at a higher rate. That decline is most impactful to long-term bonds. Longer-term bonds generally have a higher duration relative to shorter-term bonds, meaning prices are more sensitive to changes in yields. A larger portion of the value of long-term bonds is attributable to future cash flows relative to shorter-term bonds. When yields rise, all else equal, the price of future cash flows has greater impact on longer-term bonds to produce a yield equivalent to newly issued bonds at current rates.
For long-term investors, higher yields available on newly issued bonds can improve prospective future returns of the bond allocation within a diversified portfolio. This creates greater potential for the bond allocation to help the portfolio outperform inflation and tempers returns when equities experience periods of volatility.
Starting yields are highly indicative of returns over the subsequent decade. The chart in Figure 1 plots starting 5-year U.S. Treasury yields against the forward 10-year annualized returns of a blend of intermediate-term bond indices. The chart includes yields beginning in 1926 through September 2026, capturing bear, bull, and oscillating bond environments that have occurred throughout history. The chart highlights that while rising yields may create a headwind for yesterday’s existing bondholders, historically the returns for tomorrow’s bond buyers are substantially higher.
Figure 1
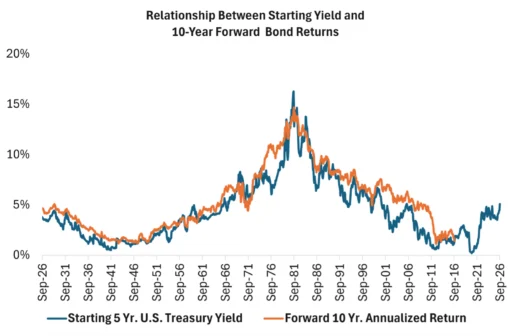
Source: 5 Yr. U.S. Treasury Yield, Daily Treasury Rate Archives, home.treasury.gov. Forward 10 Yr. Annualized Total Return is represented by the Ibbotson U.S. Intermediate-Term Government Bond Index from 1926 through 1975, and the Bloomberg U.S. Govt/Credit 5-10 Yr. TR thereafter. A description of each index is located at the end of this reading.
At today’s 5.0%+ starting yields, bonds have become attractive for their potential to provide meaningful future compensation in the form of income. While the recent increase in yields has reduced bond prices in the near term, current yields provide a rebalancing opportunity for bonds to act not only as a diversifier but to be a contributor to the total return of a diversified portfolio over the next decade.
At today’s 5.0%+ starting yields, bonds have become attractive for their potential to provide meaningful future compensation in the form of income.
Global Equities Remain Resilient Despite Fiscal, Inflation, and Debt Level Pressures
Stock markets are forward-looking, continually pricing-in future expectations and adjusting asset prices so that forward return projections remain positive. Geopolitical developments, inflation concerns, and changing fiscal policy may create uncertainty among investors, however stock prices tend to reflect expectations of future developments, not a reaction to what has already occurred.
There is no single factor that explains the continued strength of the equities market. A resilient labor market continues to support steady U.S. consumption. The market’s opinion of rising U.S. Treasury yields could be viewed not as a signal of deteriorating fundamentals but an indication of stronger economic growth. The scale of AI-related spending continues to fuel GDP growth. Each of these factors could potentially be a contributor to the resiliency of the equity market’s performance, but with no clear catalyst, broad diversification remains important in an evolving market environment.
Positive performance across multiple focus areas contributed to expanded market breadth year to date through September 30, 2026. Energy-related investments soared in Q3 as tensions in the Middle East re-escalated during the period, leading to higher oil and gas prices. The Morningstar Category average return for energy-related portfolios is 29.35% year to date. Deep value companies trading at very low valuation multiples have received significant inflows during the year. This tailwind is reflected in the year to date performance of the Morningstar U.S. Small Value and U.S. Large Value category average returns of 13.35% and 12.01%, respectfully. International markets are continuing to benefit from investor inflows looking to capitalize on increased government spending, attractive valuation discounts relative to U.S. markets, and the expansion of the AI-trade in non-U.S. areas. The year to date Morningstar Category average returns for International Large Value and International Large Growth are 13.07% and 6.82%, respectfully.
Disclosures
The views, opinions and content presented are for informational purposes only and reflect the current opinion of the writers as of September 30, 2026. Examples, charts and/or graphs provided are for illustrative purposes only, should not be used to predict security prices or market levels, and are not intended to be reflective of results you can expect to achieve. Opinions and forward-looking statements expressed are subject to change without notice. The content presented does not constitute investment advice, should not be used as the basis for any investment decision, and does not purport to provide any legal, tax or accounting advice. Information is based on data gathered from what we believe are reliable sources. It is not guaranteed as to accuracy, does not purport to be complete and is not intended to be used as a primary basis for investment decisions. It should also not be construed as advice meeting the particular investment needs of any investor.
Past performance is not indicative of future results. All investing is subject to risk, including the possible loss of the money you invest. There is no guarantee that any particular asset allocation or mix of funds will meet your investment objectives or provide you with a given level of income. Diversification does not ensure a profit or protect against a loss.
Mason Investment Advisory Services, Inc. (“Mason”) is an independent investment adviser registered with the U.S. Securities and Exchange Commission. Registration does not imply a certain level of skill or training. More information about Mason, including our investment strategies, fees, and objectives, is included in the Form ADV Part 2, which is available upon request.
This communication is not intended as a recommendation or as investment advice of any kind. It is not provided in a fiduciary capacity and may not be relied upon for, or in connection with, the making of investment decisions. Nothing herein constitutes or should be construed as an offering of advisory services or an offer to sell or a solicitation to buy any securities. Investing involves risk, including the possible loss of principal. All content is provided for informational or educational purposes only.
Asset Class and Index Descriptions
Bloomberg U.S. Government/Credit 5-10 Year TR: This index tracks the performance of intermediate term U.S. government and corporate bonds with maturities of 5-10 Years.
Energy Category: Equity energy portfolios invest primarily in equity securities of U.S. or non-U.S. companies who conduct business primarily in energy-related industries. This includes, but is not limited to companies in alternative energy, coal, exploration, oil and gas services, pipelines, natural gas services and refineries.
Ibbotson U.S. Intermediate-Term Government Bond Index: This is an unweighted index which measures the performance of five-year maturity U.S. Treasury Bonds. Each year a one-bond portfolio containing the shortest noncallable bond having a maturity of not less than five years is constructed. Bonds with impaired negotiability or special redemption privileges are omitted, as are partially or fully tax-exempt bonds starting in 1943. To measure holding period returns for the one-bond portfolio, the bond is priced (with accrued coupons) over the holding period and total returns are calculated.
Intermediate-Term Bonds: Intermediate-term bond portfolios invest primarily in corporate and other investment-grade U.S. fixed-income issues and have durations of 3.5 to six years (or if duration is unavailable, average effective maturities of four to 10 years). These portfolios are less sensitive to interest rates, and therefore less volatile, than portfolios that have longer durations.
International Large Growth: International large-growth portfolios focus on high-priced growth stocks, mainly outside of the United States. Most of these portfolios divide their assets among a dozen or more developed markets, including Japan, Britain, France, and Germany. These portfolios primarily invest in stocks that have market caps in the top 70% of each economically integrated market (such as Europe or Asia ex-Japan). Growth is defined based on fast growth (high growth rates for earnings, sales, book value, and cash flow) and high valuations (high price rations and low dividend yields). International Large Growth is referred to as Foreign Large Growth in Morningstar
International Large Value: International large-value portfolios invest mainly in big international stocks that are less expensive or growing more slowly than other large-cap stocks. Most of these portfolios divide their assets among a dozen or more developed markets, including Japan, Britain, France, and Germany. These portfolios primarily invest in stocks that have market caps in the top 70% of each economically integrated market (such as Europe or Asia ex-Japan). Value is defined based on low valuations (low price ratios and high dividend yields) and slow growth (low growth rates for earnings, sales, book value, and cash flow). International Large Value is referred to as Foreign Large Value in Morningstar.
U.S. Large Value: Large-value portfolios invest primarily in big U.S. companies that are less expensive or growing more slowly than other large-cap stocks. Stocks in the top 70% of the capitalization of the U.S. equity market are defined as large-cap. Value is defined based on low valuations (low price ratios and high dividend yields) and slow growth (low growth rates for earnings, sales, book value, and cash flow).
U.S. Small Value: Small-value portfolios invest in small U.S companies with valuations and growth rates below other small-cap peers. Stocks in the bottom 10% of the capitalization of the U.S. equity market are defined as small-cap. Value is defined based on low valuations (low price ratios and high dividend yields) and slow growth (low growth rates for earnings, sales, book value, and cash flow).