


Authored By Scott George, Co-Chief Executive Officer, Co-Chief Investment Officer, and President, Thomas Rolfe Pudner, CFA, CPA, CFP®, MST, Co-CIO & Co-Director of Research and Jason S. Doyle, Co-Director of Research | Mason Investment Advisory Services, Inc.
Key Takeaways
- Global markets advanced during the second quarter of 2026 as easing geopolitical tensions in the Middle East helped broad indices recover from first-quarter losses.
- Most major asset classes entered the second half of 2026 as positive performers, with many generating double-digit returns.
- A supportive economic backdrop – particularly lower interest rates relative to the previous three years and shifting market sentiment beyond mega cap technology sparked a rotation into small and micro-cap companies.
- Diversification and discipline remain the foundation of a sound long-term investment approach, helping investors stay the course through periods of volatility.
Market Summary
Easing Geopolitical Tensions Helped Global Markets Advance
Global markets advanced during the second quarter of 2026 as easing geopolitical tensions in the Middle East helped broad market indices recover from first-quarter losses.
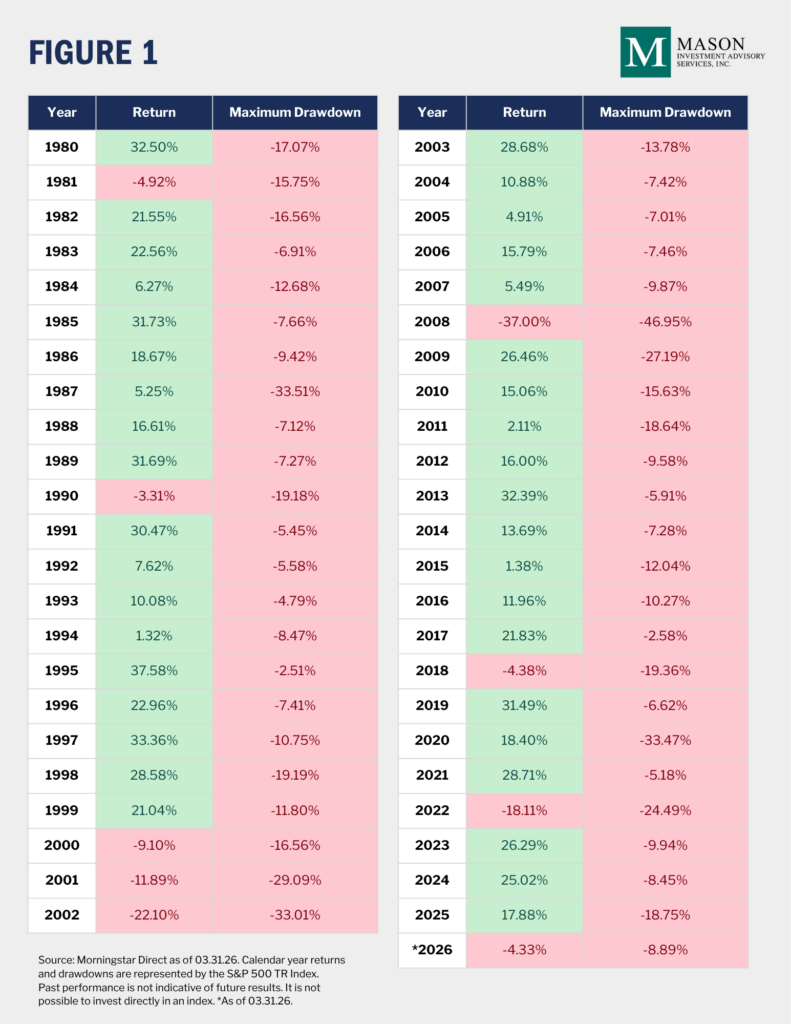
Figure 1 displays the yearly returns and maximum drawdowns of the U.S. equity market, proxied by the S&P 500 TR Index, including the maximum intra-quarter drawdown of -8.89% and the quarter-end loss of -4.33% as of the end of the first quarter of 2026.
Staying Invested Through Volatility
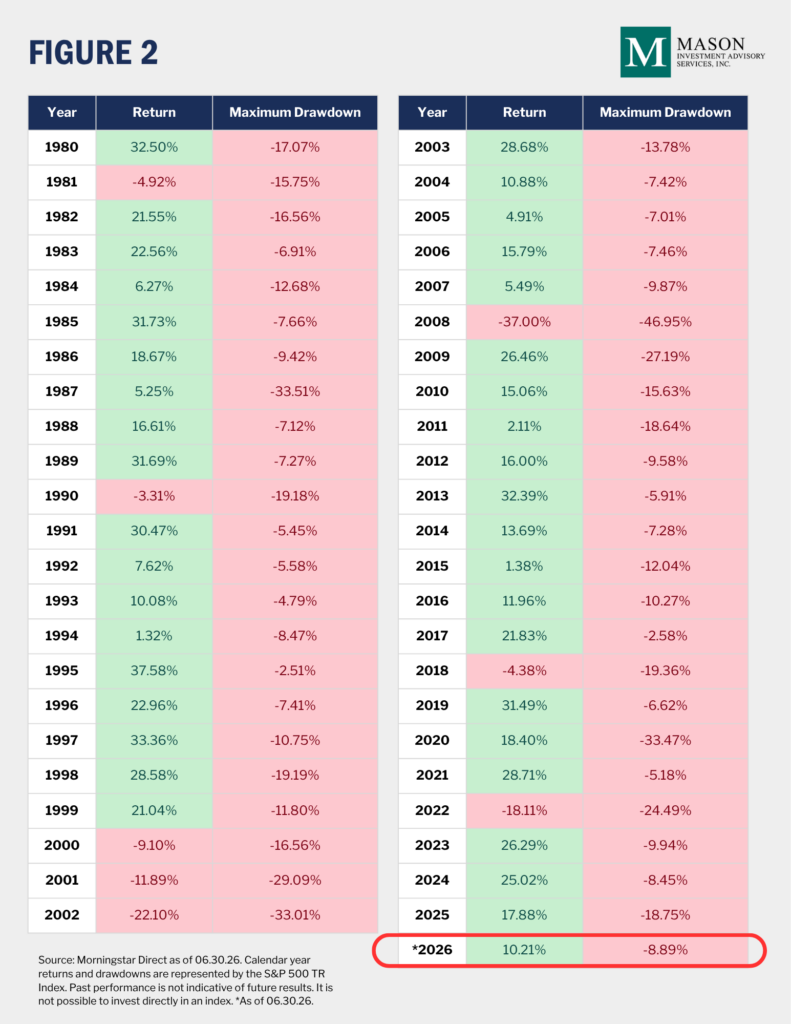
The updated performance data as of June 30 shows the U.S. equity market’s shift to positive territory for the year, despite the first-quarter drawdown. This pattern illustrates how frequently markets experience volatility, and how quickly they can recover. Understanding this historical tendency can help investors remain committed during periods of uncertainty, since only those who stay invested fully participate in the subsequent rebound.
During periods of uncertainty, investors are often tempted to try to time the market by reducing exposure to limit losses and reentering once conditions stabilize. This approach can work against long-term returns for two key reasons:
- Accurately identifying the market bottom is extremely difficult.
- The market’s largest single-day gains often occur shortly after the bottom is reached.
An analysis of the U.S. equity market, proxied by the S&P 500 TR Index from January 1990 through June 2026, shows that missing the single best day of performance would have reduced the total annualized return from 10.88% to 10.55%. Missing the five best days over the same period would have reduced the annualized return to 9.43%.
While the geopolitical uncertainty of the first quarter weighed on broad indices and multiple asset classes, disciplined, diversified portfolios were generally rewarded for avoiding short-term allocation shifts based on headlines and predictions.
Broadening Market Leadership
Energy was a standout performer in the first quarter: the average return of the Morningstar Energy category during the period was 30.97%, reflecting energy’s historically low correlation to broader equities and its tendency to perform well during periods of rising or elevated inflation.
As market uncertainty eased during the second quarter, leadership broadened well beyond energy. Small-cap, value-oriented, and U.S. real estate equities were among the strongest performing categories during the period.
The average returns of the U.S. large value, U.S. small value, and U.S. small blend categories through June 30, 2026, were 11.30%, 19.74%, and 21.59%, respectively.
Looking Forward
A Disciplined Approach to Portfolio Evaluation
Ongoing evaluation of fund and manager lineups is a hallmark of sound portfolio management, aimed at ensuring continued use of high-quality, low-cost investment vehicles that support long-term goals. Not every evaluation results in a change, but the exercise itself is part of maintaining discipline across market cycles.
One trend worth watching: actively managed ETFs continue to gain market share within the universe of U.S. open-end funds, driven by their tax efficiency and typically lower expenses relative to comparable mutual funds, alongside the potential to outperform the broader market through active management.
Disclosures
The views, opinions and content presented are for informational purposes only and reflect the current opinion of the writers as of June 30, 2026. Examples, charts and/or graphs provided are for illustrative purposes only, should not be used to predict security prices or market levels, and are not intended to be reflective of results you can expect to achieve. Opinions and forward-looking statements expressed are subject to change without notice. The content presented does not constitute investment advice, should not be used as the basis for any investment decision, and does not purport to provide any legal, tax or accounting advice. Information is based on data gathered from what we believe are reliable sources. It is not guaranteed as to accuracy, does not purport to be complete and is not intended to be used as a primary basis for investment decisions. It should also not be construed as advice meeting the particular investment needs of any investor.
Past performance is not indicative of future results. All investing is subject to risk, including the possible loss of the money you invest. There is no guarantee that any particular asset allocation or mix of funds will meet your investment objectives or provide you with a given level of income. Diversification does not ensure a profit or protect against a loss.
This information is provided for educational purposes only and is not meant to represent any specific investment advice provided by Mason. Mason Investment Advisory Services, Inc. (“Mason”) is an independent investment adviser registered with the U.S. Securities and Exchange Commission. Registration does not imply a certain level of skill or training. More information about Mason, including our investment strategies, fees, and objectives, is included in the Form ADV Part 2, which is available upon request.
This communication is not intended as a recommendation or as investment advice of any kind. It is not provided in a fiduciary capacity and may not be relied upon for, or in connection with, the making of investment decisions. Nothing herein constitutes or should be construed as an offering of advisory services or an offer to sell or a solicitation to buy any securities. Investing involves risk, including the possible loss of principal. All content is provided for informational or educational purposes only.
Asset Class and Index Descriptions
S&P 500 TR Index: The S&P 500 TR Index is a readily available, carefully constructed, market-value-weighted index of large company stock performance. Market-value-weighted means that the weight of each stock in the index, for a given month, is proportionate to its market capitalization (price times the number of shares outstanding) at the beginning of the month. Currently, the S&P Composite includes 500 of the largest stocks (in terms of stock market value) in the United States; prior to March 1957 it consisted of 90 of the largest stocks.
Energy Category: Equity energy portfolios invest primarily in equity securities of U.S. or non-U.S. companies who conduct business primarily in energy-related industries. This includes, but is not limited to companies in alternative energy, coal, exploration, oil and gas services, pipelines, natural gas services, and refineries.
U.S. Large Value: Large-value portfolios invest primarily in big U.S. companies that are less expensive or growing more slowly than other large-cap stocks. Stocks in the top 70% of the capitalization of the U.S. equity market are defined as large-cap. Value is defined based on low valuations (low price ratios and high dividend yields) and slow growth (low growth rates for earnings, sales, book value, and cash flows).
U.S. Small Cap Blend: Small-blend portfolios favor U.S. firms at the smaller end of the market capitalization range. Some aim to own an array of value and growth stocks while others employ a discipline that leads to holdings with valuations and growth rates close to the small-cap averages. Stocks in the bottom 10% of the capitalization of the U.S. equity market are defined as small cap. The blend style is assigned to portfolios where neither growth nor value characteristics predominate.